There are many many great javascript chart plugins that can be used to display data in a wide variety of chart formats. Canvasjs is very easy to use and deploy and can be integrated into your application. The documentation for Canvasjs here https://canvasjs.com/docs/charts/basics-of-creating-html5-chart/ describes a simple vertical bar chart that can be rendered using approximately 30 lines of code. Looking at the example it can be noted that data to be displayed in the chart itself is JSON data of the following format.
[  { label: "apple",
         y: 10  },
   { label: "orange",
         y: 15  },
   { label: "banana",
         y: 25  },
   { label: "mango",
         y: 30  },
   { label: "grape",
         y: 28  }]
This means that if we can produce data from our application which takes on this format with the specific data labels of "label" and "y" we should be able to present it in chart form relatively easily. Note that the "y" data is numeric and therefore presented without quotes around it.
Rather than use a MySQL View as we have done in other examples, this time we will simply use a Model class to control how and what data should be presented. This model class will be based on the member table but will hide all of the fields from the table. It will introduce two new fields "label", and "y". The label fields will be a concatenation of the members firstname and surname and the "y" attribute will be the total number of bookings that the member has made in the system. To make all the usual fields hidden we will add them to the $hidden attribute. To make the label and y attributes we will make dynamic attributes in the class using getLabelAttribute() and getYAttribute() dynamic attribute functions. These functions behave like magic methods of a sort and the values returned by the functions will be given when the label and y attributes of the class are viewed. To create this class, add the following code to \App\Models\memberbookingschart
<?php

namespace App\Models;
use Illuminate\Database\Eloquent\Model as Model;

class memberbookingschart extends Model
{
    public $table = 'member';
    public $timestamps = false;

    public $hidden = ['id','membertype','firstname','surname','dateofbirth','created_at','updated_at','deleted_at','memberimage','rank','bookings'];

    protected $appends = ['label','y'];

    public function getLabelAttribute()
    {
        return $this->firstname . " " . $this->surname;
    }

    public function getYAttribute()
    {
        return $this->bookings->count();
    }

    public function bookings()
    {
        return $this->hasMany(\App\Models\Booking::class, 'memberid');
    }

}
The $this->bookings->count() function uses the bookings() dynamic attribute method to calculate how many bookings have been created by each member. We can now use this model class to return json with label, and y attributes of the kind required by CanvasJs.
To view this data we need a controller function and a matching route. Add the following function to \app\Http\Controllers\memberController.php
    public function jsonTotalBookings()
    {
        $content = \App\Models\memberbookingschart::all()->toJson();
        return response($content)->withHeaders([
                'Content-Type' => 'application/json',
                'charset' => 'UTF-8'
            ]);
    }
This function returns data from the Memberbookingschart model class above in json format with the appropriate json headers. To be able to retrieve this JSON data add the following line to \routes\web.php
Route::get('/member/all/totalbookings', 'App\Http\Controllers\memberController@jsonTotalBookings')->name('members.jsontotalbookings');
Now when you visit http://localhost:8000/member/all/totalbookings the following json data will be displayed.
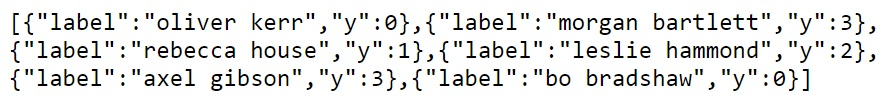
This data will dynamically change over time as tennis club members create new bookings and will allow us to display dynamic chart-based data. In the next post, we'll look at including the plugin and having it display data drawn from the above route.