**If you're not using Laravel mix you can simply add a link to a CDN of CanvasJs into the Larvel view below -if you google CanvasJS CDN you'll find links and script tags for a suitably hosted CDN of CanvasJS**
Installing CanvasJS for use with npm Laravel Mix
In order to install CanvasJs type the following command into the Command Line Interface for your application while ensuring you are in the application root folder.
npm install canvasjs
There are number of different versions of CanvasJS that download when you install the plugin - the one indicated in the code below seems to work correctly with jquery. Before rebuilding your app.js and app.css files edit the \resources\js\app.js file and add the following line
require('canvasjs/dist/canvasjs.3.js');
Then, to rebuild your app.js file, run the following command in your application folder
npm run dev
Now CanvasJs is bundled into your app.js file with your other plugins, and can be used where necessary. Remember to ensure your app.js and app.css files are pulled in correctly (probably in your resources/layouts/app.blade.php file) as described elsewhere in the blog.
In order to render the chart we need to first get the JSON. For this we use jquery $.get. $.get uses an asynchronous call to get the JSON data. This means that the code will continue to execute other and subsequent instructions after it makes the http request which retrieves the data. Only when the data is actually retrieved will the code inside the function be executed. This allows us to delay the rendering of the chart until we have the data for it -bthereby negating the effect of any delay which may be caused by slow networks or servers between where the data is and where the request is being made. If we don't do it this way the code will continue to execute and jquery will attempt to draw the graph before the JSON data is returned. The data is retrieved from the members.jsontotalbookings route which we created in the last post. The function called on completion of $.get will pass the data it retrieves as an argument to the function. In this case, we have called the argument "data". To see all this working, place the code below in a file called /resources/views/members/bookingschart.blade.php.
@extends('layouts.app')
@section('content')
<div id="chartContainer" style="height: 300px; width: 100%;"></div>
<script type="text/javascript">
$.get("{{route('members.jsontotalbookings')}}", function( data ) {
	    var chart = new CanvasJS.Chart("chartContainer", {
        data: [
          {
            type: "column",
            dataPoints: data,
          }
        ]
    });
    chart.render();
});
</script>
@endsection
To allow us to view this route we need a controller function and a matching route. Add the following function to \App\Http\Controllers\memberController.php
    public function bookingsChart()
    {
        return view('members.bookingschart');
    }
To make this function work add the following route to \routes\web.php
Route::get('/member/all/bookingschart', 'App\Http\Controllers\memberController@bookingschart')->name('members.bookingschart');Now when you visit http://localhost:8000/member/all/bookingschart you will see the following chart displayed.
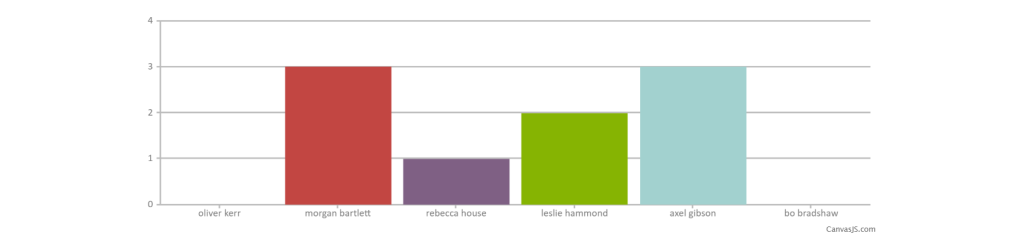
Bear in mind that the style of the chart can be changed easily enough by changing the setting type: "column" in the bookingschart.blade.php view.